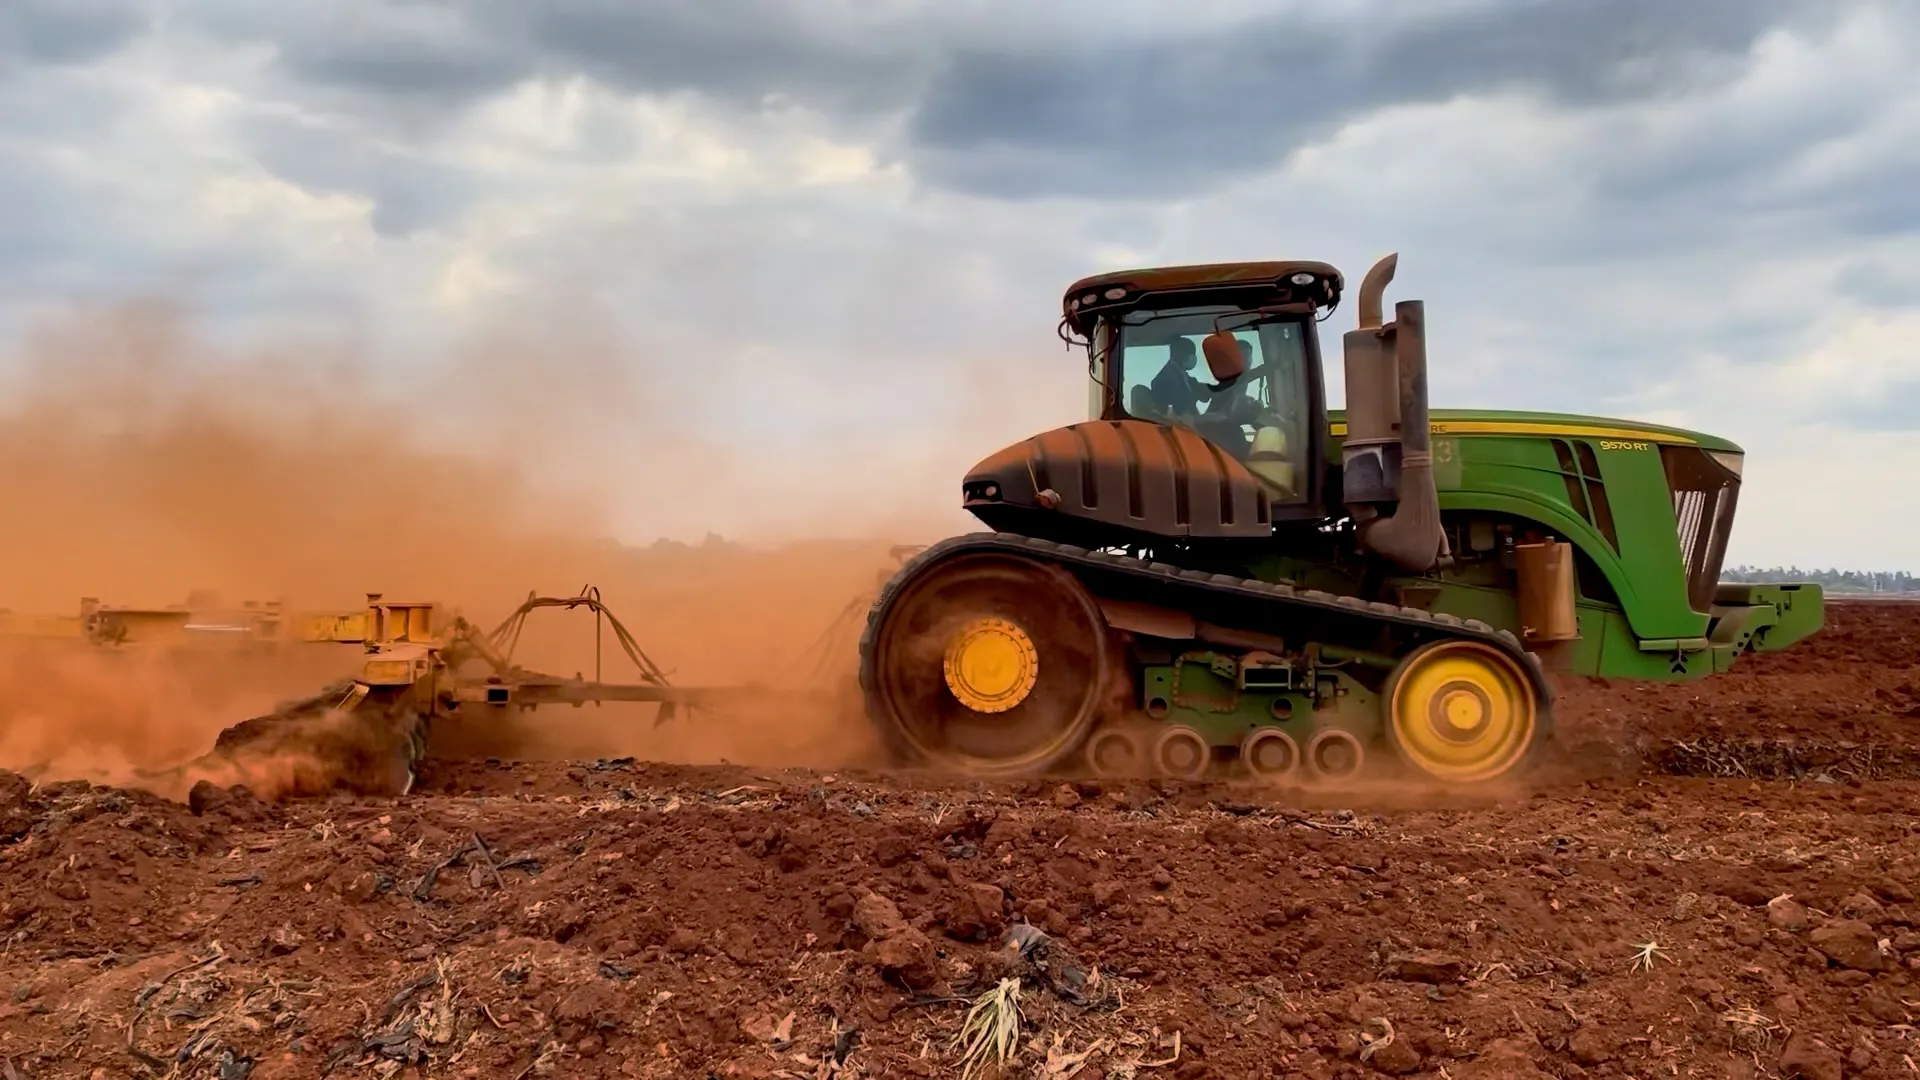
Scale Your Farming.
Supporting the challenge of a new agriculture
Field-born technology, working alongside farmers. From apps and hardware for everyday farm work to software development and consulting for connected, automated machinery.
BY THE NUMBERS
AgriBus in numbers
as of 2026-10
2M+
Downloads (Google Play)200+
Countries & regions5,431,358
Recorded work sessions4,825,959km
Distance driven in the last 12 months
LIVE AROUND THE WORLD
Right now, somewhere in the world.
Users working in the last 24 hours
Active countries & regions (last 24h)- Aggregated from live app usage (updates about every 5 minutes). Green dots are countries active in the last 30 minutes.
PRODUCTS
Products
See all productsSoftware
App
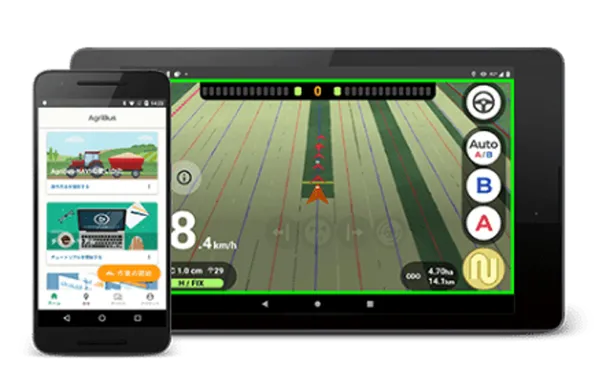
AgriBus-NAVI
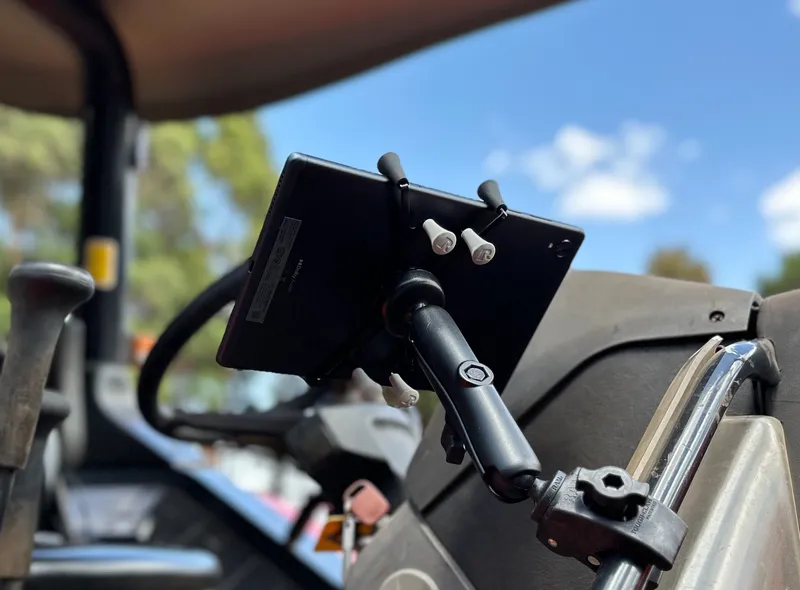
A GNSS guidance app that is free to start. Subscribe to AgriBus Professional for full features.
Free(In-app purchases)
About the AgriBus Professional plan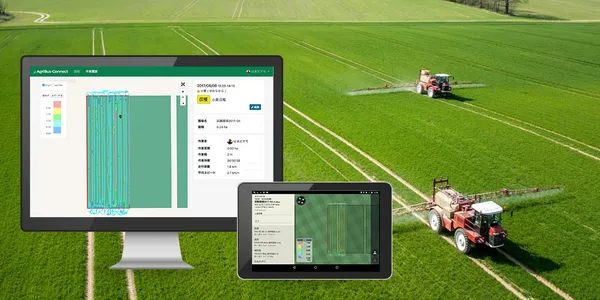
Cloud
AgriBus-Web
Free with user registration. Subscribe to AgriBus Professional for full features.
Free(Registration required)
About the AgriBus Professional plan
Plans
Subscription planShared by AgriBus-NAVI and AgriBus-Web
AgriBus Professional
Full features of AgriBus-NAVI and AgriBus-Web with one subscription. 30-day free trial included.
Prices vary by country and purchase method (Google Play / Web). See prices on Google Play
AgriBus Enterprise for companies and institutions is in preparation. Contact us for details.
Hardware


AGRIBUS-DWH
Returning the insight in field-work data to farmers and to the people who deliver our food
Work data recorded with AgriBus is turned into anonymous statistics (about 11 km cells) that cannot identify any single farm, and delivered to farmers first. The same statistics are offered to companies, researchers and public bodies, and the revenue is reinvested in tools for farmers. This is AgriBus-DWH, our data warehouse initiative.
Crop monitors
Daily updates on field-work progress, regional weather, supply-demand statistics and market observation signals for the main soybean and wheat regions of Brazil, the United States and the Black Sea. Included at no extra cost for AgriBus-NAVI / AgriBus-Web paid-plan members.
News feed
Field-work activity in your area (about 33 km) and the wider region (about 55 km) compared with last year and the long-term average, plus posts and photos from other farmers and weekly monitor reports.
Elevation and VRA maps
Elevation maps from the GNSS altitude in your work records or satellite DEM (Copernicus DEM), and variable-rate (VRA) zone maps from Sentinel-2 vegetation indices. Exported as ISOXML and synced to AgriBus-NAVI, which shows the rate for your current position while driving.
Data services (API and MCP)
Regional field-work activity, weather anomalies, observation signals and public supply-demand statistics for companies, researchers and public bodies, via REST API and MCP. Plans for academic and public use are available.
The anonymous statistics compare regional activity and do not evaluate any individual farm. Market observation material is not investment advice.
FOR YOU